
See where your AI tokens actually go.
Most usage trackers tell you how much you spent. Artificiency tells you why. It reads your Claude Code transcripts on your own machine and turns them into a dashboard of spend, cache churn, token waste, and whether that workflow change actually helped.
Free and open source under MIT. Local-first. In active early development.
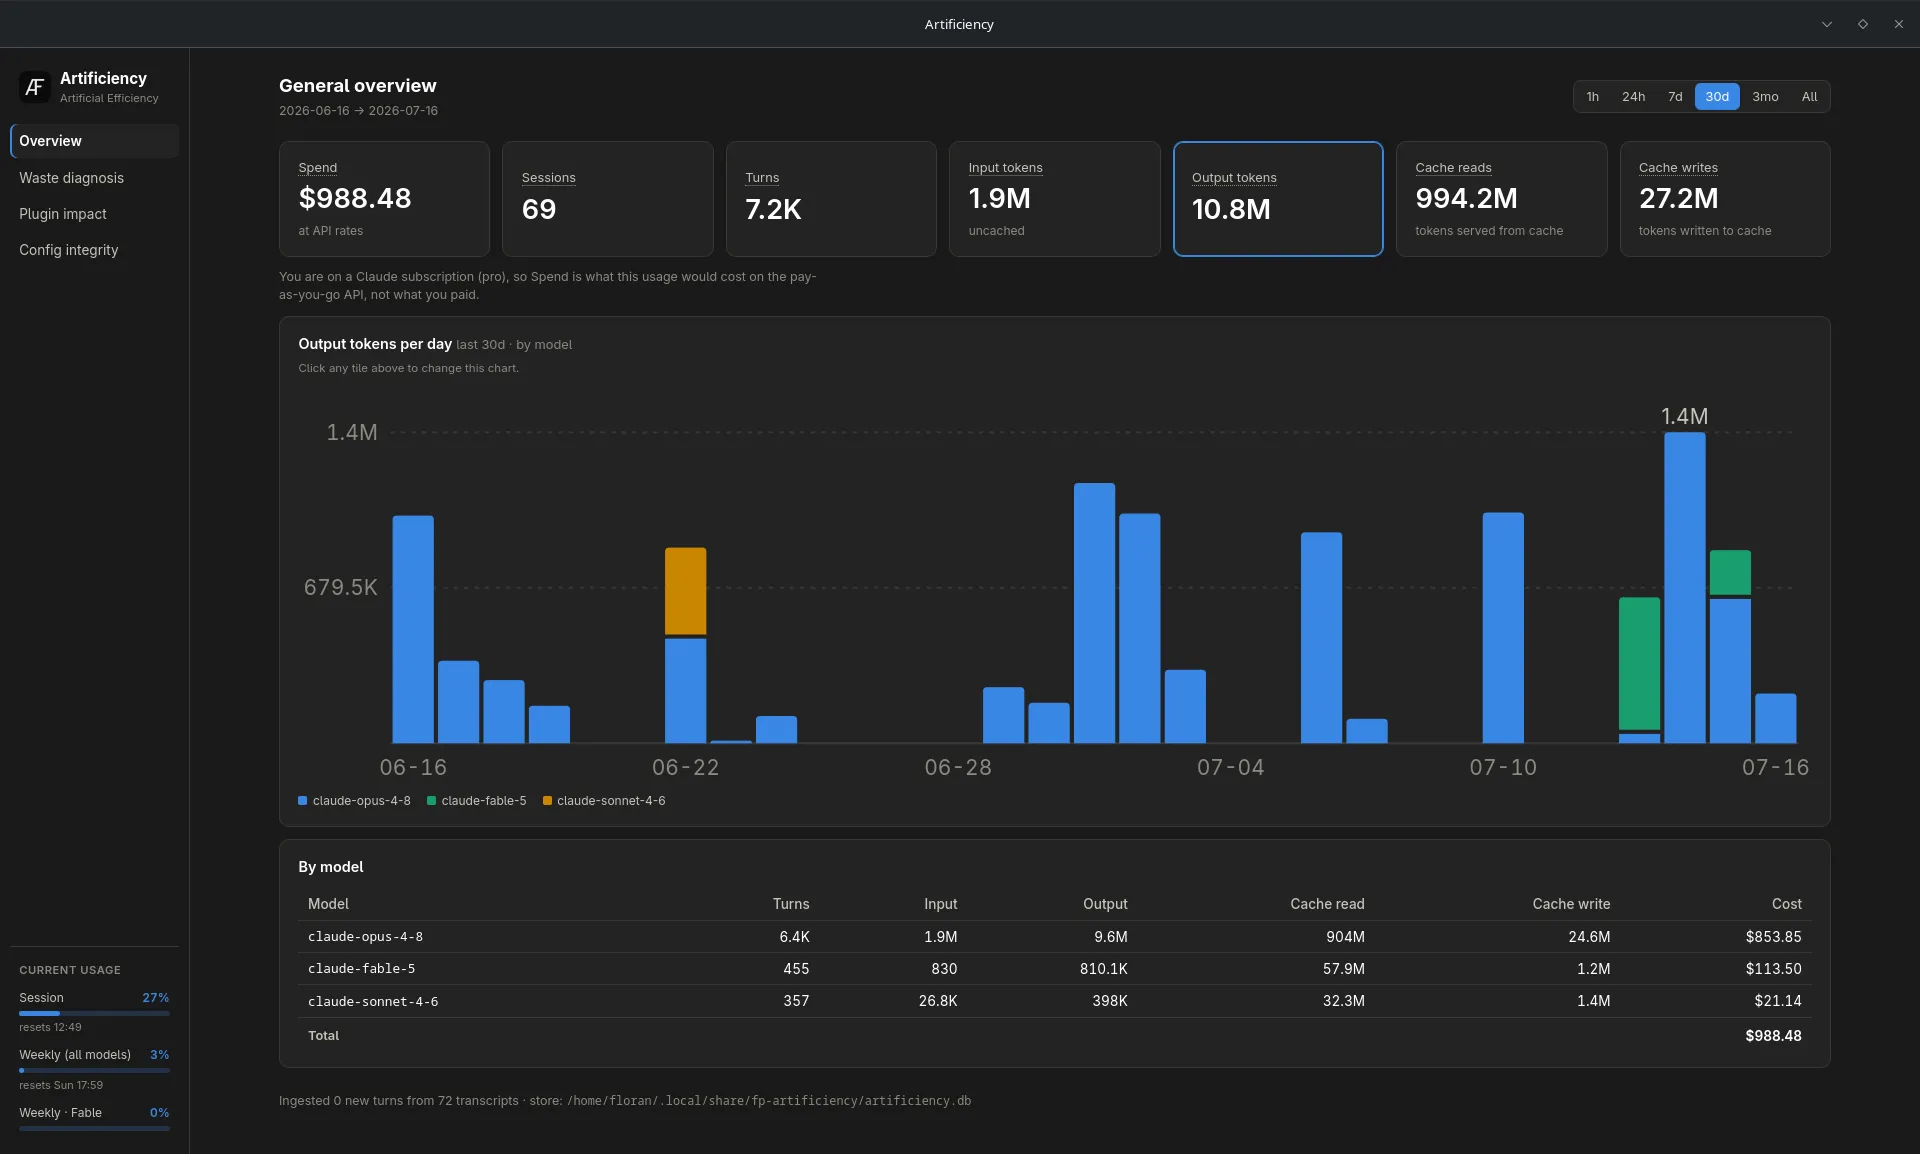
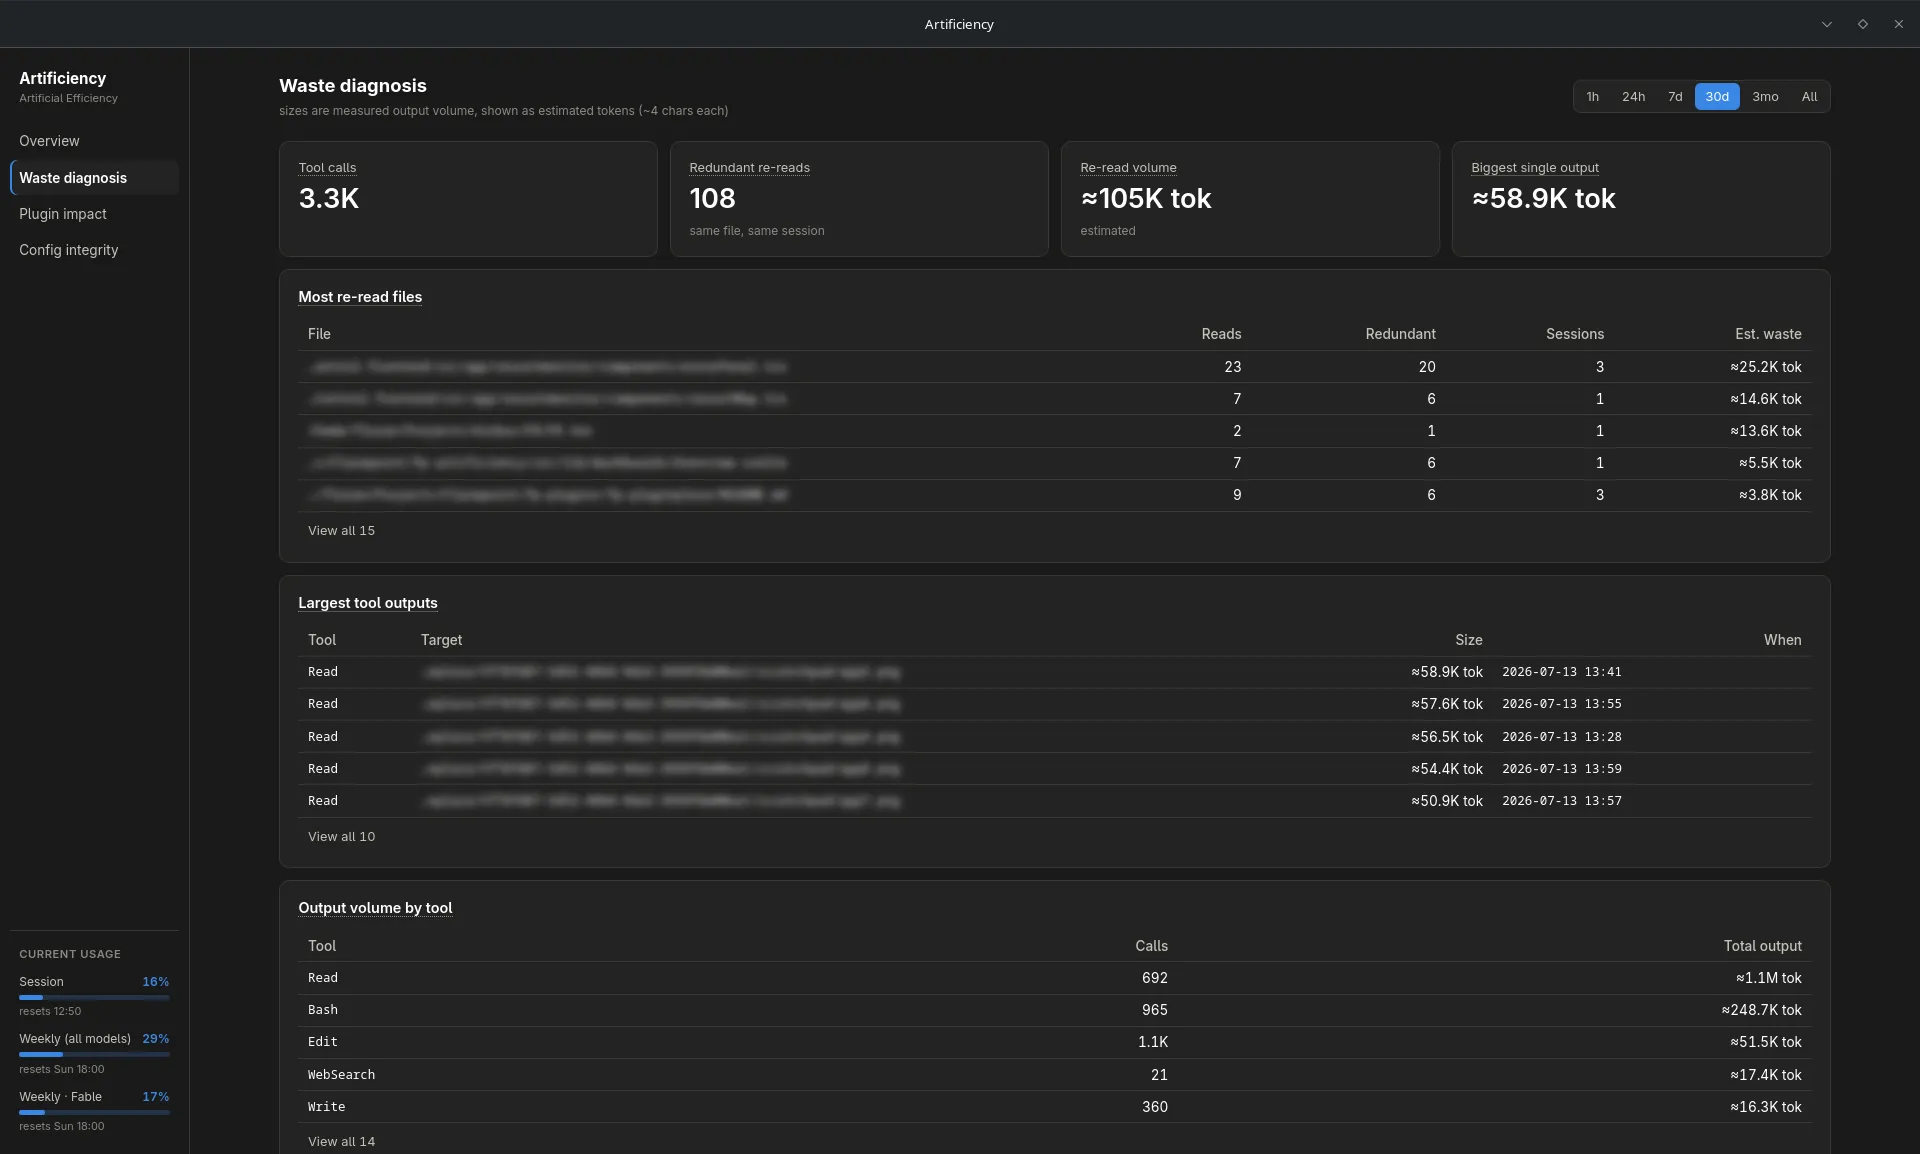
Find the waste, not just the total.
The waste view names the token sinks other trackers average away. Files re-read in the same session, the largest single tool outputs, and output volume per tool, each with an estimate of the tokens involved and a tip on avoiding it.
- Redundant file re-reads, counted per file and per session
- Oversized tool dumps ranked by estimated tokens
- Output volume per tool across your whole history
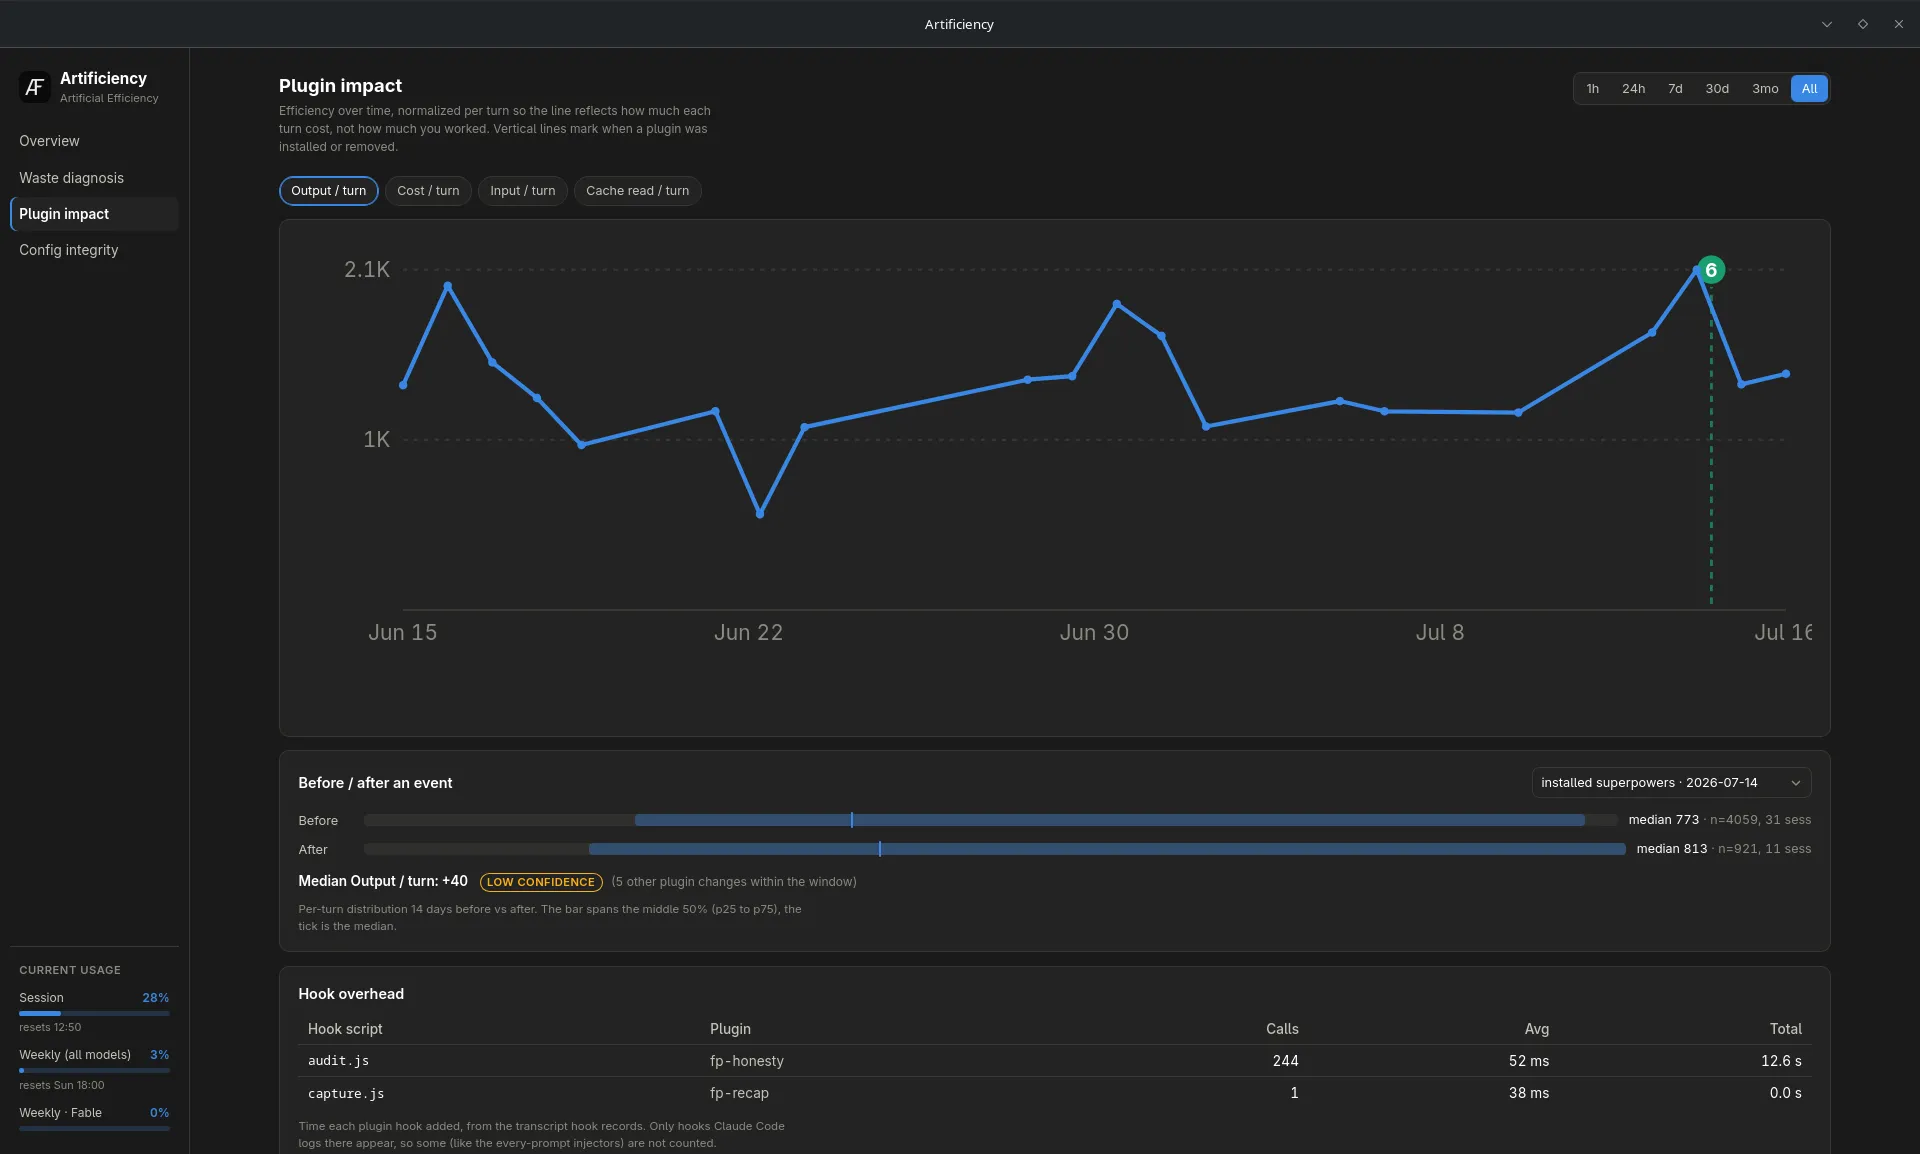
Did that change actually help?
Edited your CLAUDE.md, installed a plugin, or switched workflow? Plugin impact tracks efficiency per turn over time, marks the moment a plugin was installed or removed, and compares the before and after distributions so you get an honest answer, confidence caveats included.
- Per-turn output, cost, input, and cache reads over time
- Before and after medians around any config event
- Hook overhead timed per plugin script
What it does today
Honest scope. Artificiency is pre-1.0 and moving fast.
| Spend & tokens | Per model at pay-as-you-go API rates, over any range from 1 hour to all time |
|---|---|
| Waste diagnosis | Redundant re-reads, largest tool outputs, and volume per tool, with token estimates |
| Plugin impact | Per-turn efficiency over time with before and after comparisons per config event |
| Usage limits | Session and weekly subscription meters, read from the same source the official view uses |
| Cost engine | Input, output, and cache read/write pricing computed locally per model |
| Providers | Claude today. Codex, Gemini, and OpenRouter planned as dimensions of one dashboard |
| Platforms | Built on Linux. macOS and Windows preview builds available, first-class support planned |
| Storage | A local SQLite database. First run backfills your existing transcript history |
Open source, all the way down.
Artificiency is MIT-licensed and developed in the open: a Rust core, a Tauri v2 shell, and a Svelte 5 dashboard. Read the code, build it yourself, or file an issue. Pull requests open up once the architecture settles.